Covid isn’t scary anymore: how the authorities stopped reckoning with the coronavirus when it suited them
Tatiana Torocheshnikova
TV Rain
October 15, 2021
The Russian authorities are often criticized for ignoring the pandemic to the good of the political conjuncture. It was with an eye to politics, and not to the numbers for illnesses and deaths caused by covid-19, according to critics, that decisions were made to hold a referendum on amending the Constitution and lift covid restrictions in the run-up to the referendum last year. The same criticism was leveled against the Crimea annexation anniversary concert in March of this year at Luzhniki Stadium in Moscow, and the Euro 2020 matches and the Crimson Sails event held in Petersburg. How justified is this criticism? To answer this question, TV Rain studied the covid-19 task force’s official data on coronavirus infections and deaths, as well as Rosstat’s data on mortality from the spring of 2020 to the autumn of this year.
“A number of large shopping centers have already received a warning this week. And work on monitoring compliance with the mask mandate will be intensified and implemented even more vigorously,” Alexei Nemeryuk, head of the Moscow department of trade and services, said on Monday, September 27, a week after the elections to the State Duma. A week later, Prime Minister Mikhail Mishustin noted that the spread of the coronavirus caused “serious concern,” while the head of the consumer and public health watchdog Rospotrebnadzor said that the situation was “extremely tense.”
By this time, the decline in the number of new covid-19 cases, which had continued since late July, had stopped and an uptickd had begun. A similar surge in morbidity was observed in mid-June, when the more contagious delta variant began to sweep Russia. The two other waves of covid-19 epidemic occurred in the spring and autumn/winter of 2020.
How the authorities first reckoned with covid waves, then stopped
If we superimpose the most important events for the authorities in 2020 — the 75th Victory Day Parade and the vote on the Constitution — on the curve tracking incidence of the coronavirus, we can see that both events were held after the first wave of covid-19 had subsided. As this graph bears out, there was no increase in infections after these events either.
The situation was different this year. Only some of the Kremlin’s high-profile events took place in favorable epidemiological circumstances. The concert in Luzhniki, attended by Vladimir Putin, was held at a time when the increase in new cases of covid-19 was at the lowest level for this year. The same can be said about the 2021 Victory Day parade.
A new coronavirus wave kicked off in mid-June, but this did not prevent the authorities from holding UEFA Euro 2020 group stage matches, which ended on the crest of the wave of infections, in Petersburg. It would be difficult to call favorable the numbers of new infections during Petersburg’s Crimson Sails celebration for school-leavers. The cancellation of QR codes in Moscow in late July is also difficult to explain in terms of positive morbidity figures.
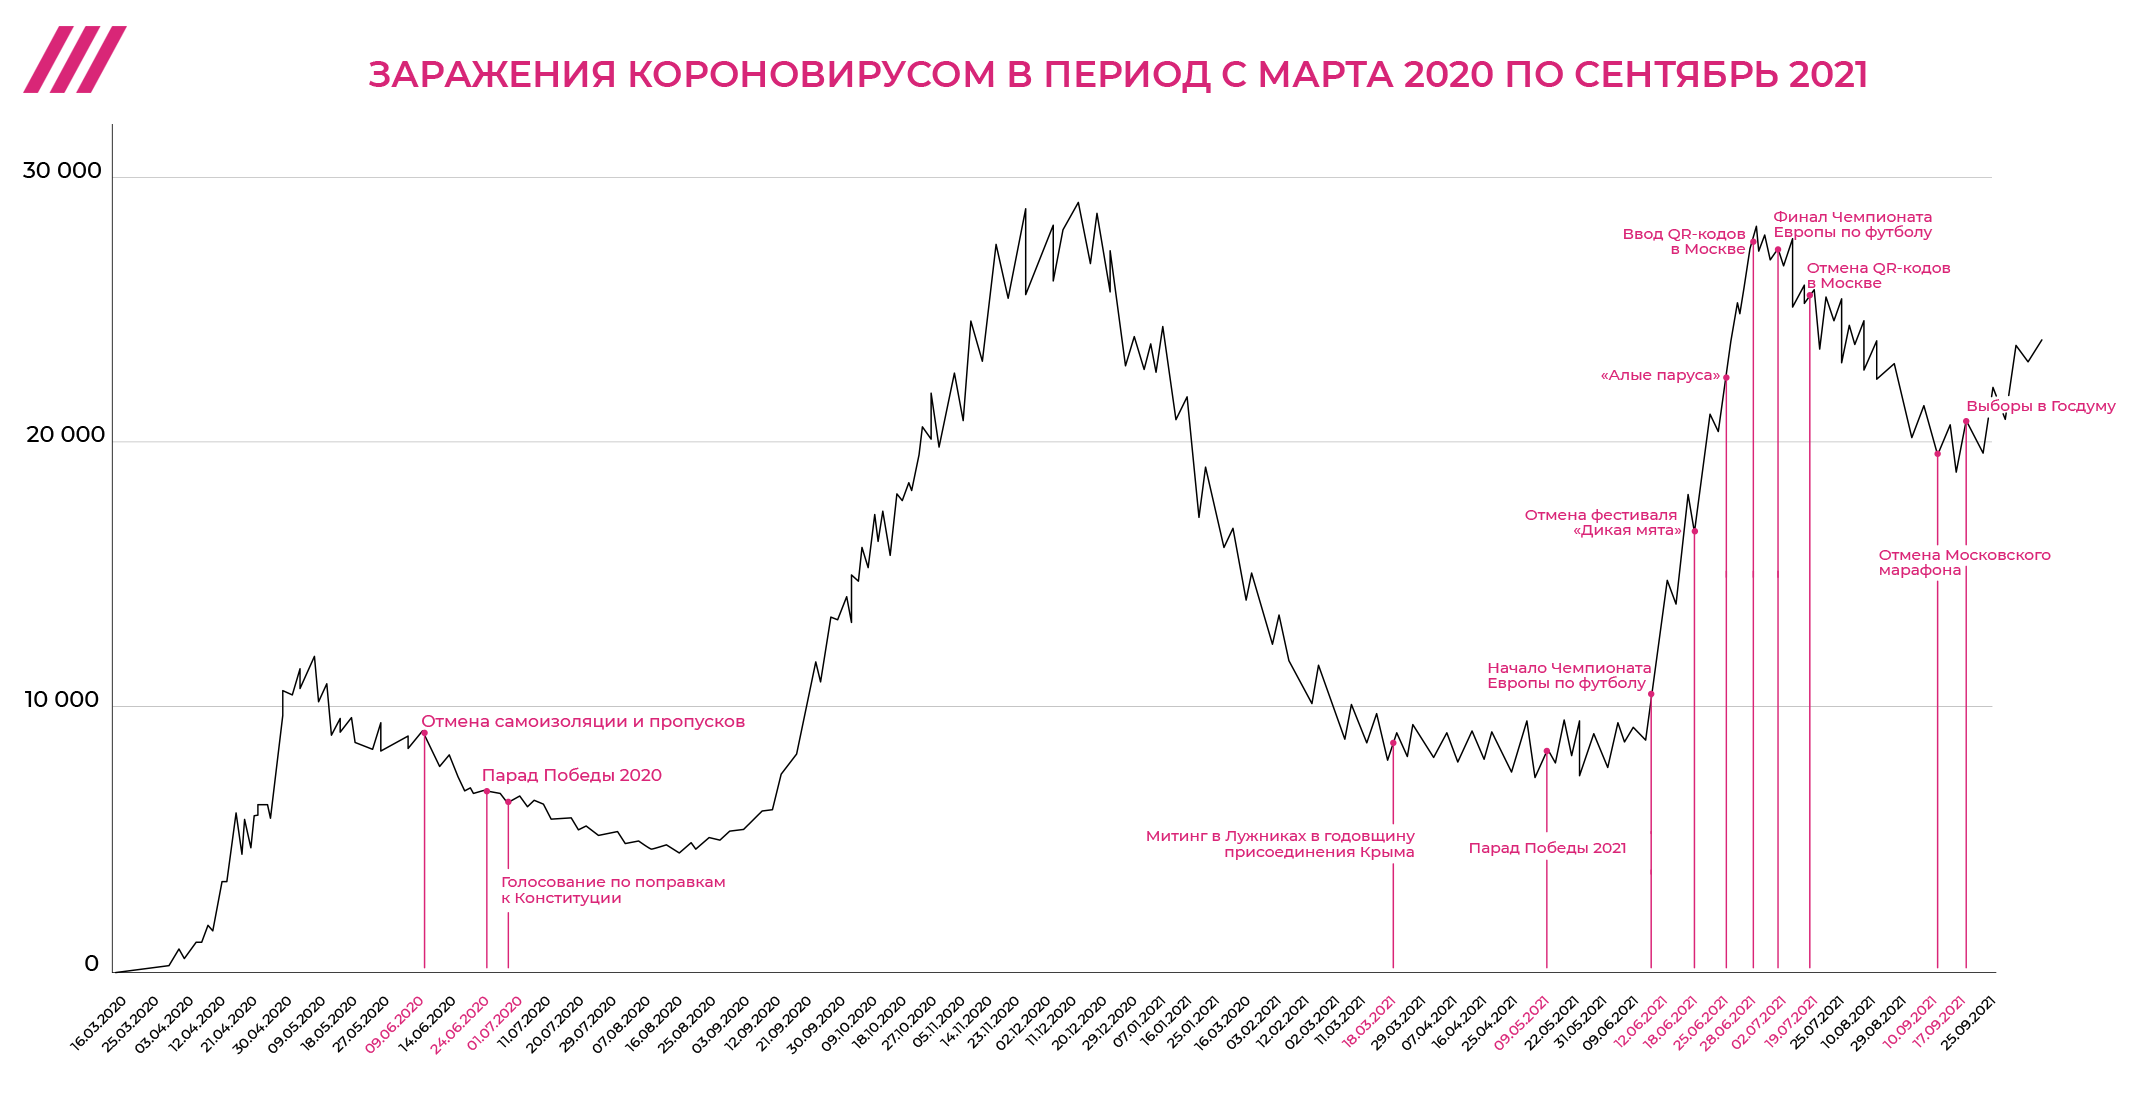 Coronavirus infections in Russia between March 2020 and September 2021. Key public events (and cancelled events) during this period are identified and marked in red, including the 2020 Victory Day parade in Moscow, the constitutional referendum in July 2020, the Crimson Sails celebration in Petersburg in June 2021, and parliamentary elections in September 2021. Courtesy of TV Rain
Can we trust official data on numbers of infections?
During the pandemic, demographers and epidemiologists have repeatedly drawn attention to the peculiar numbers issued by the covid-19 task force. “I always start the conversation like this: forget that there is a task force. It is pointless to discuss that today, for some reason, there were exactly one thousand fewer or more cases recorded than yesterday. Why? Because. Because the gladiolus. Because that’s the figure they thought up yesterday,” says independent demographer Alexei Raksha, one of the principal critics of the official figures. Back in July 2020, after the vote on amending the Constitution, he noted an unusual drop in the number of infections. “In late June [2020], we were told that there had been a certain decline in even symptomatic cases, and then the numbers went up again after July 1,” Raksha said.
The 2003 KVN skit by the Ural Dumplings that gave birth to the “Because the gladiolus” meme.
In his opinion, internet searches are the most accurate indicator of covid-19’s spread. “The incidence curve lags way behind. I use only Yandex searches — for example, searches for ‘sense of smell’ reflect the trends better than others,” he explains.
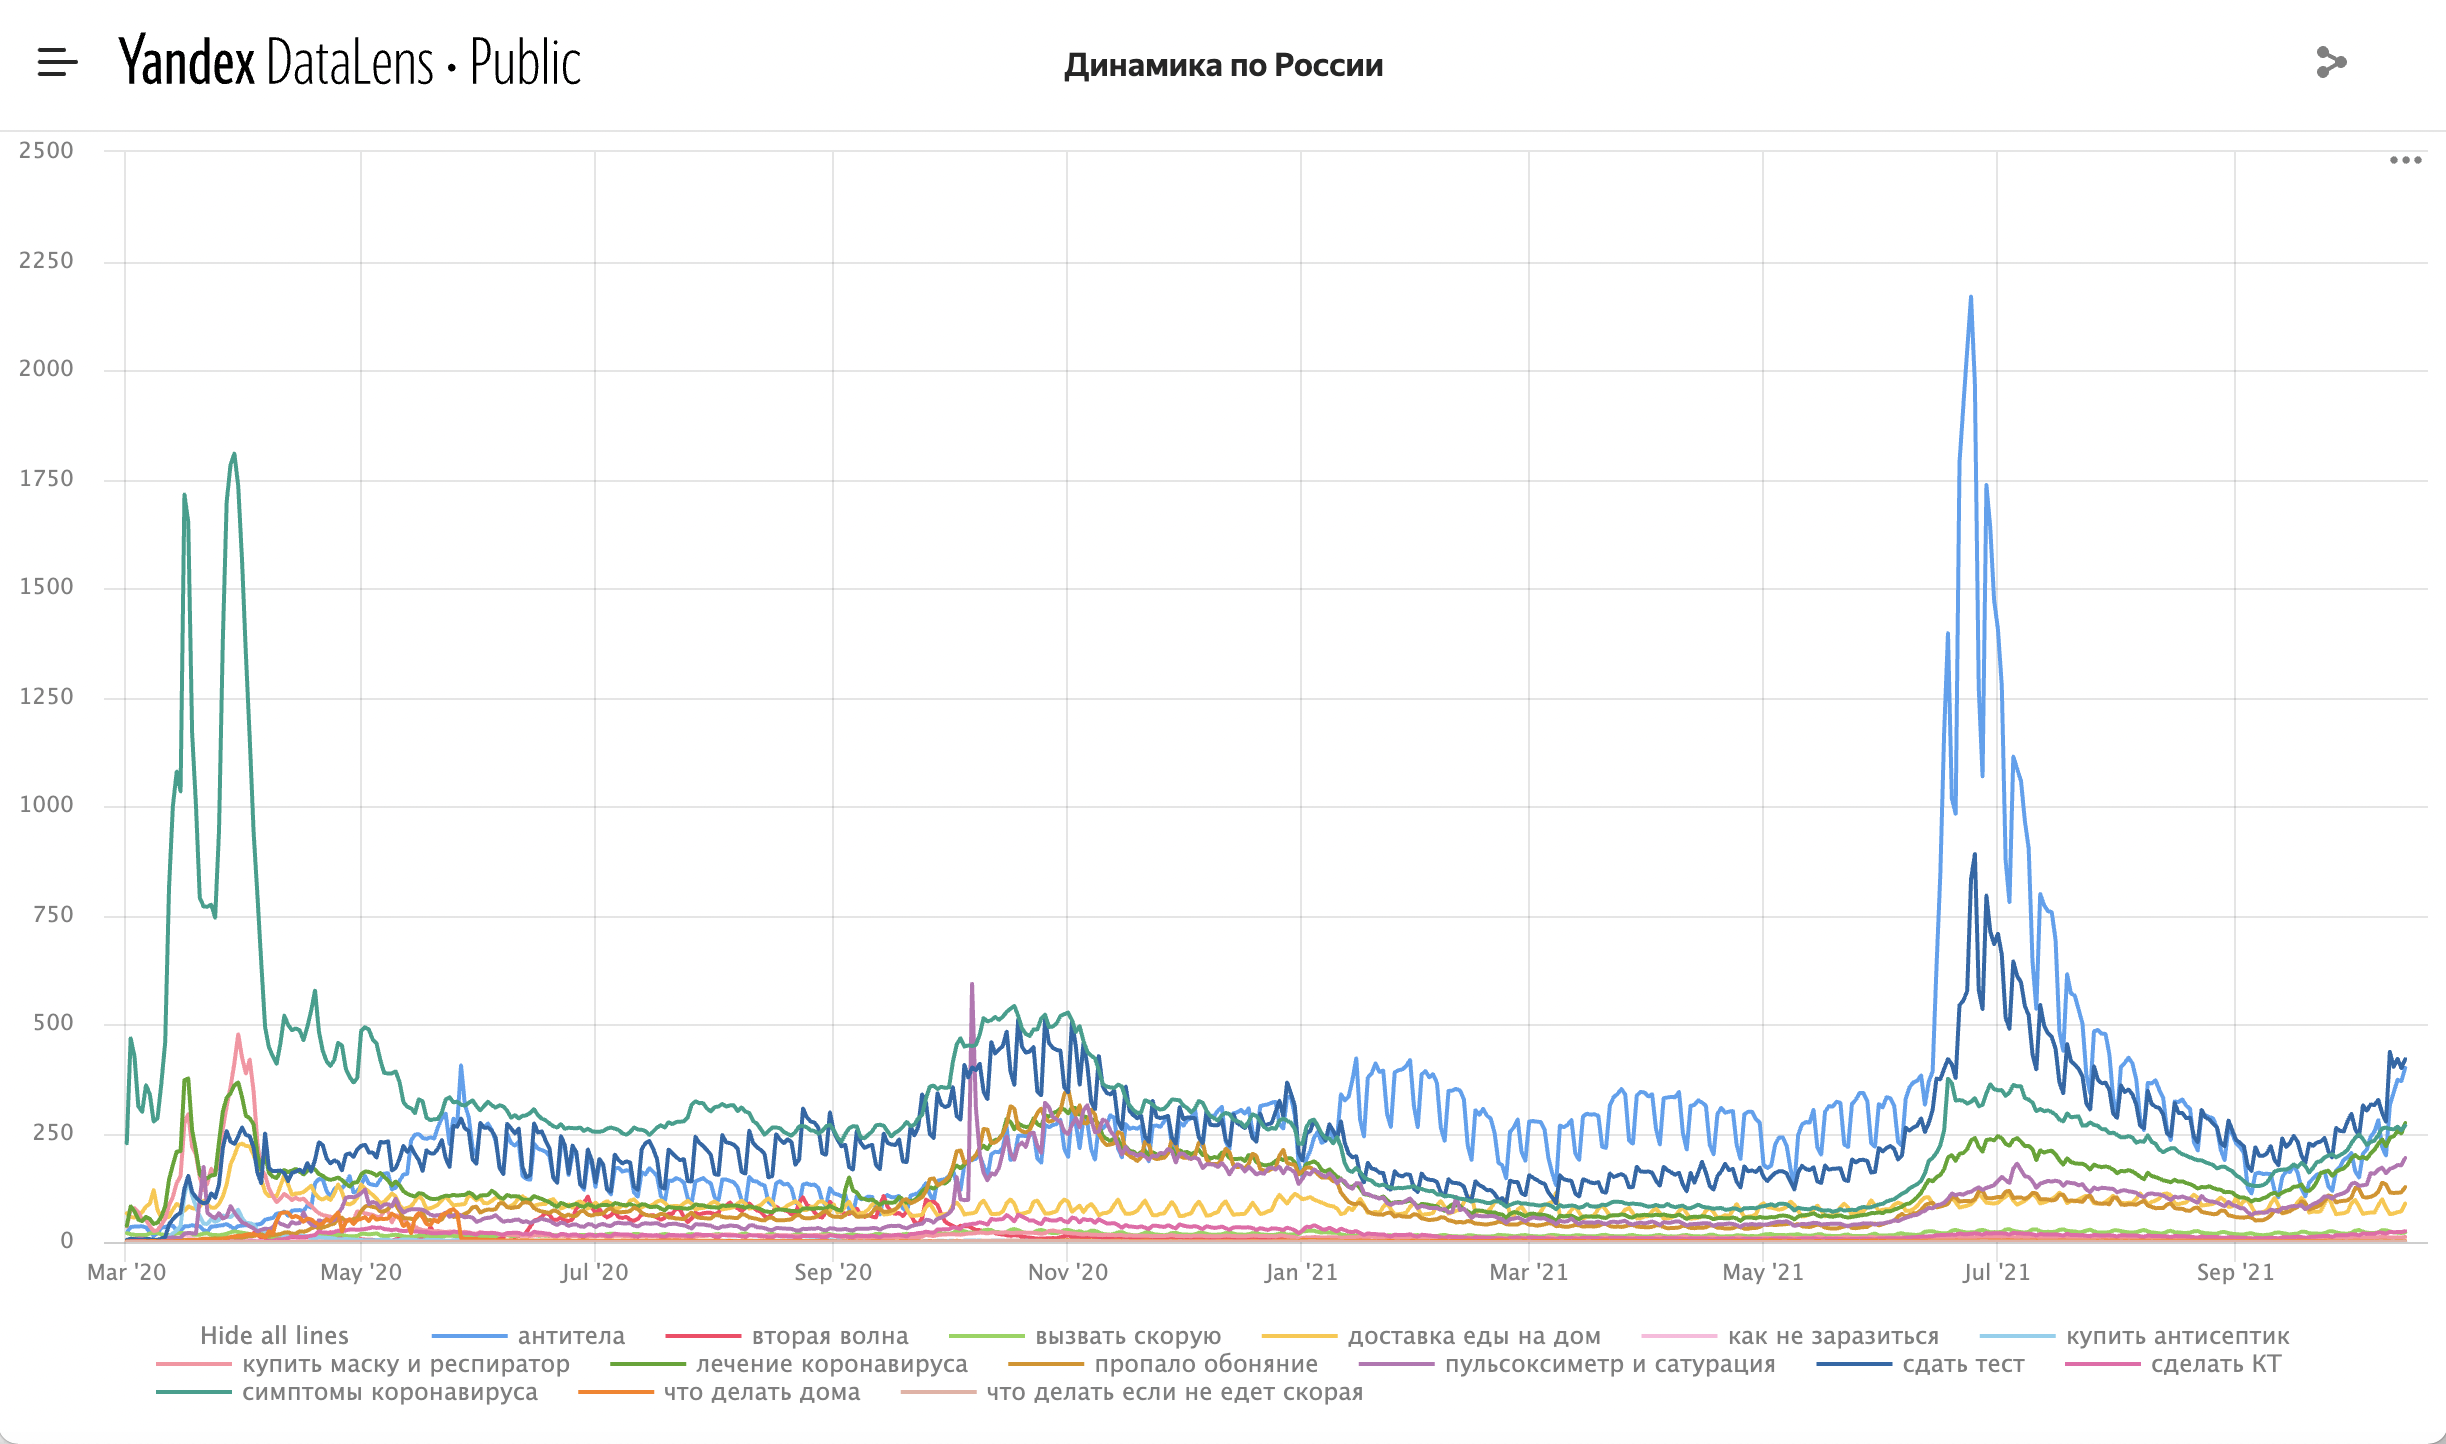
Trends for coronavirus-related searches on Yandex between March 2020 and September 2021. The searches tracked during this period included the following terms: “antibodies,” “second wave,” “call an ambulance,” “home food delivery,” “how to avoid infection,” “buy antiseptic,” “buy mask and respirator,” “coronavirus treatment,” “loss of smell,” “oxygen saturation monitor,” “get tested,” “coronavirus symptoms,” “what to do at home,” and “what to do if ambulance doesn’t come.” Source: Yandex/TV Rain
Experts have named several possible factors for distortions in the official statistics. “First, the counting is done differently in different regions, and the epidemic moves across the country from month to month. And second, even within a particular region, the local covid-19 task force sometimes starts to do a better job of counting over time — maybe they import more tests, or they start cheating less,” says Dmitry Kobak, a data researcher from the University of Tübingen in Germany. According to him, it is also possible that the covid-19 task forces in some regions report “retroactively” — that is, for example, they issue the stats for July deaths in August.
“No one knows what deaths, exactly, are reported by the task force,” adds Sergey Timonin, a researcher at the International Laboratory for Population and Health at the Higher School of Economics. “I am not aware of regulatory documents that would explain this.”
Kobak draws attention to the fact that since the regions have started publishing statistics, so-called plateaus have regularly appeared in the data, that is, when the number of deaths has remained the same for several days, or even weeks. In September, similar “plateaus” — with the daily number of deaths hovering around 800 — appeared in the overall statistics for the country. “Previously, they showed up only within individual regions. This is interesting: it means that if the stats used to be fudged at the regional level and were added up afterwards, now, apparently, someone has been adjusting the figures after or while summing them up [for the whole country],” explains Kobak.
Verifying official mortality statistics
To get an objective picture of the coronavirus pandemic, experts use the excess mortality rate, which is the difference between real deaths and Rosstat’s forecast (that is, the number of deaths that we would expect if there were no pandemic), which, in turn, is calculated based on mortality data from previous years.
Calculations made by Alexei Raksha specially for TV Rain show that, by the end of 2020, there had been nearly 360 thousand excess deaths in Russia. At this time, the covid-19 task force’s death toll was about six times less — around 57 thousand deaths. By September 2021, excess mortality figures exceeded 675 thousand, but the covid-19 task force reported 180 thousand deaths for this same period. Since there have been no other major factors that could have had a strong impact on the life expectancy of Russians in the last two years, experts concede that it was the coronavirus that caused the serious increase in mortality in the country.
If the excess deaths graph is superimposed on the infections graph, as based on the task force’s data, we can see that they are roughly comparable. Raksha confirms this: the morbidity statistics for Russia as a whole “to some extent reflect reality when squinted at from three meters.” However, Raksha draws attention to the fact that excess mortality has been running chronologically ahead of the task force’s morbidity statistics. This may indicate that the latter are being heavily fudged, the demographer argues.
 The trends for excess mortality (in dark blue, as reported by Rosstat), deaths caused by covid-19 (light blue) and covid-19 infections (pink), as reported by the Russian covid task force, between May 2020 and August 2021
The situation is different with the official data on mortality due to covid-19. When the covid-19 task force’s date is combined with Rosstat’s figures, the two curves radically diverge.
At the same time, the “hump” on the excess mortality graph in July 2020 stands out amid falling numbers of infections. Raksha believes that part of the increase in excess mortality that month was caused by the heatwave in the Urals. In his opinion, however, this factor could have added no more than five thousand deaths across the country. The rest of the difference, according to Raksha, is explained by the deliberate “flattening” of the task force’s official data.
Nevertheless, the covid-19 task force’s figures remain the only official data source available to Russians on a daily basis. And as follows from the graphs, above, this year the Russian authorities finally stopped using even these numbers as a guide when making decisions on holding large-scale events.
Translated by the Russian Reader. Just as I was finishing this post, Mark Teeter brought to my attention this article on the same subject (also featuring Alexei Raksha) in today’s edition of the Washington Post.